Sharpe Ratio Explained: Formula, Benchmarks & Why a Sharpe > 3 Signals Fraud
Related articles
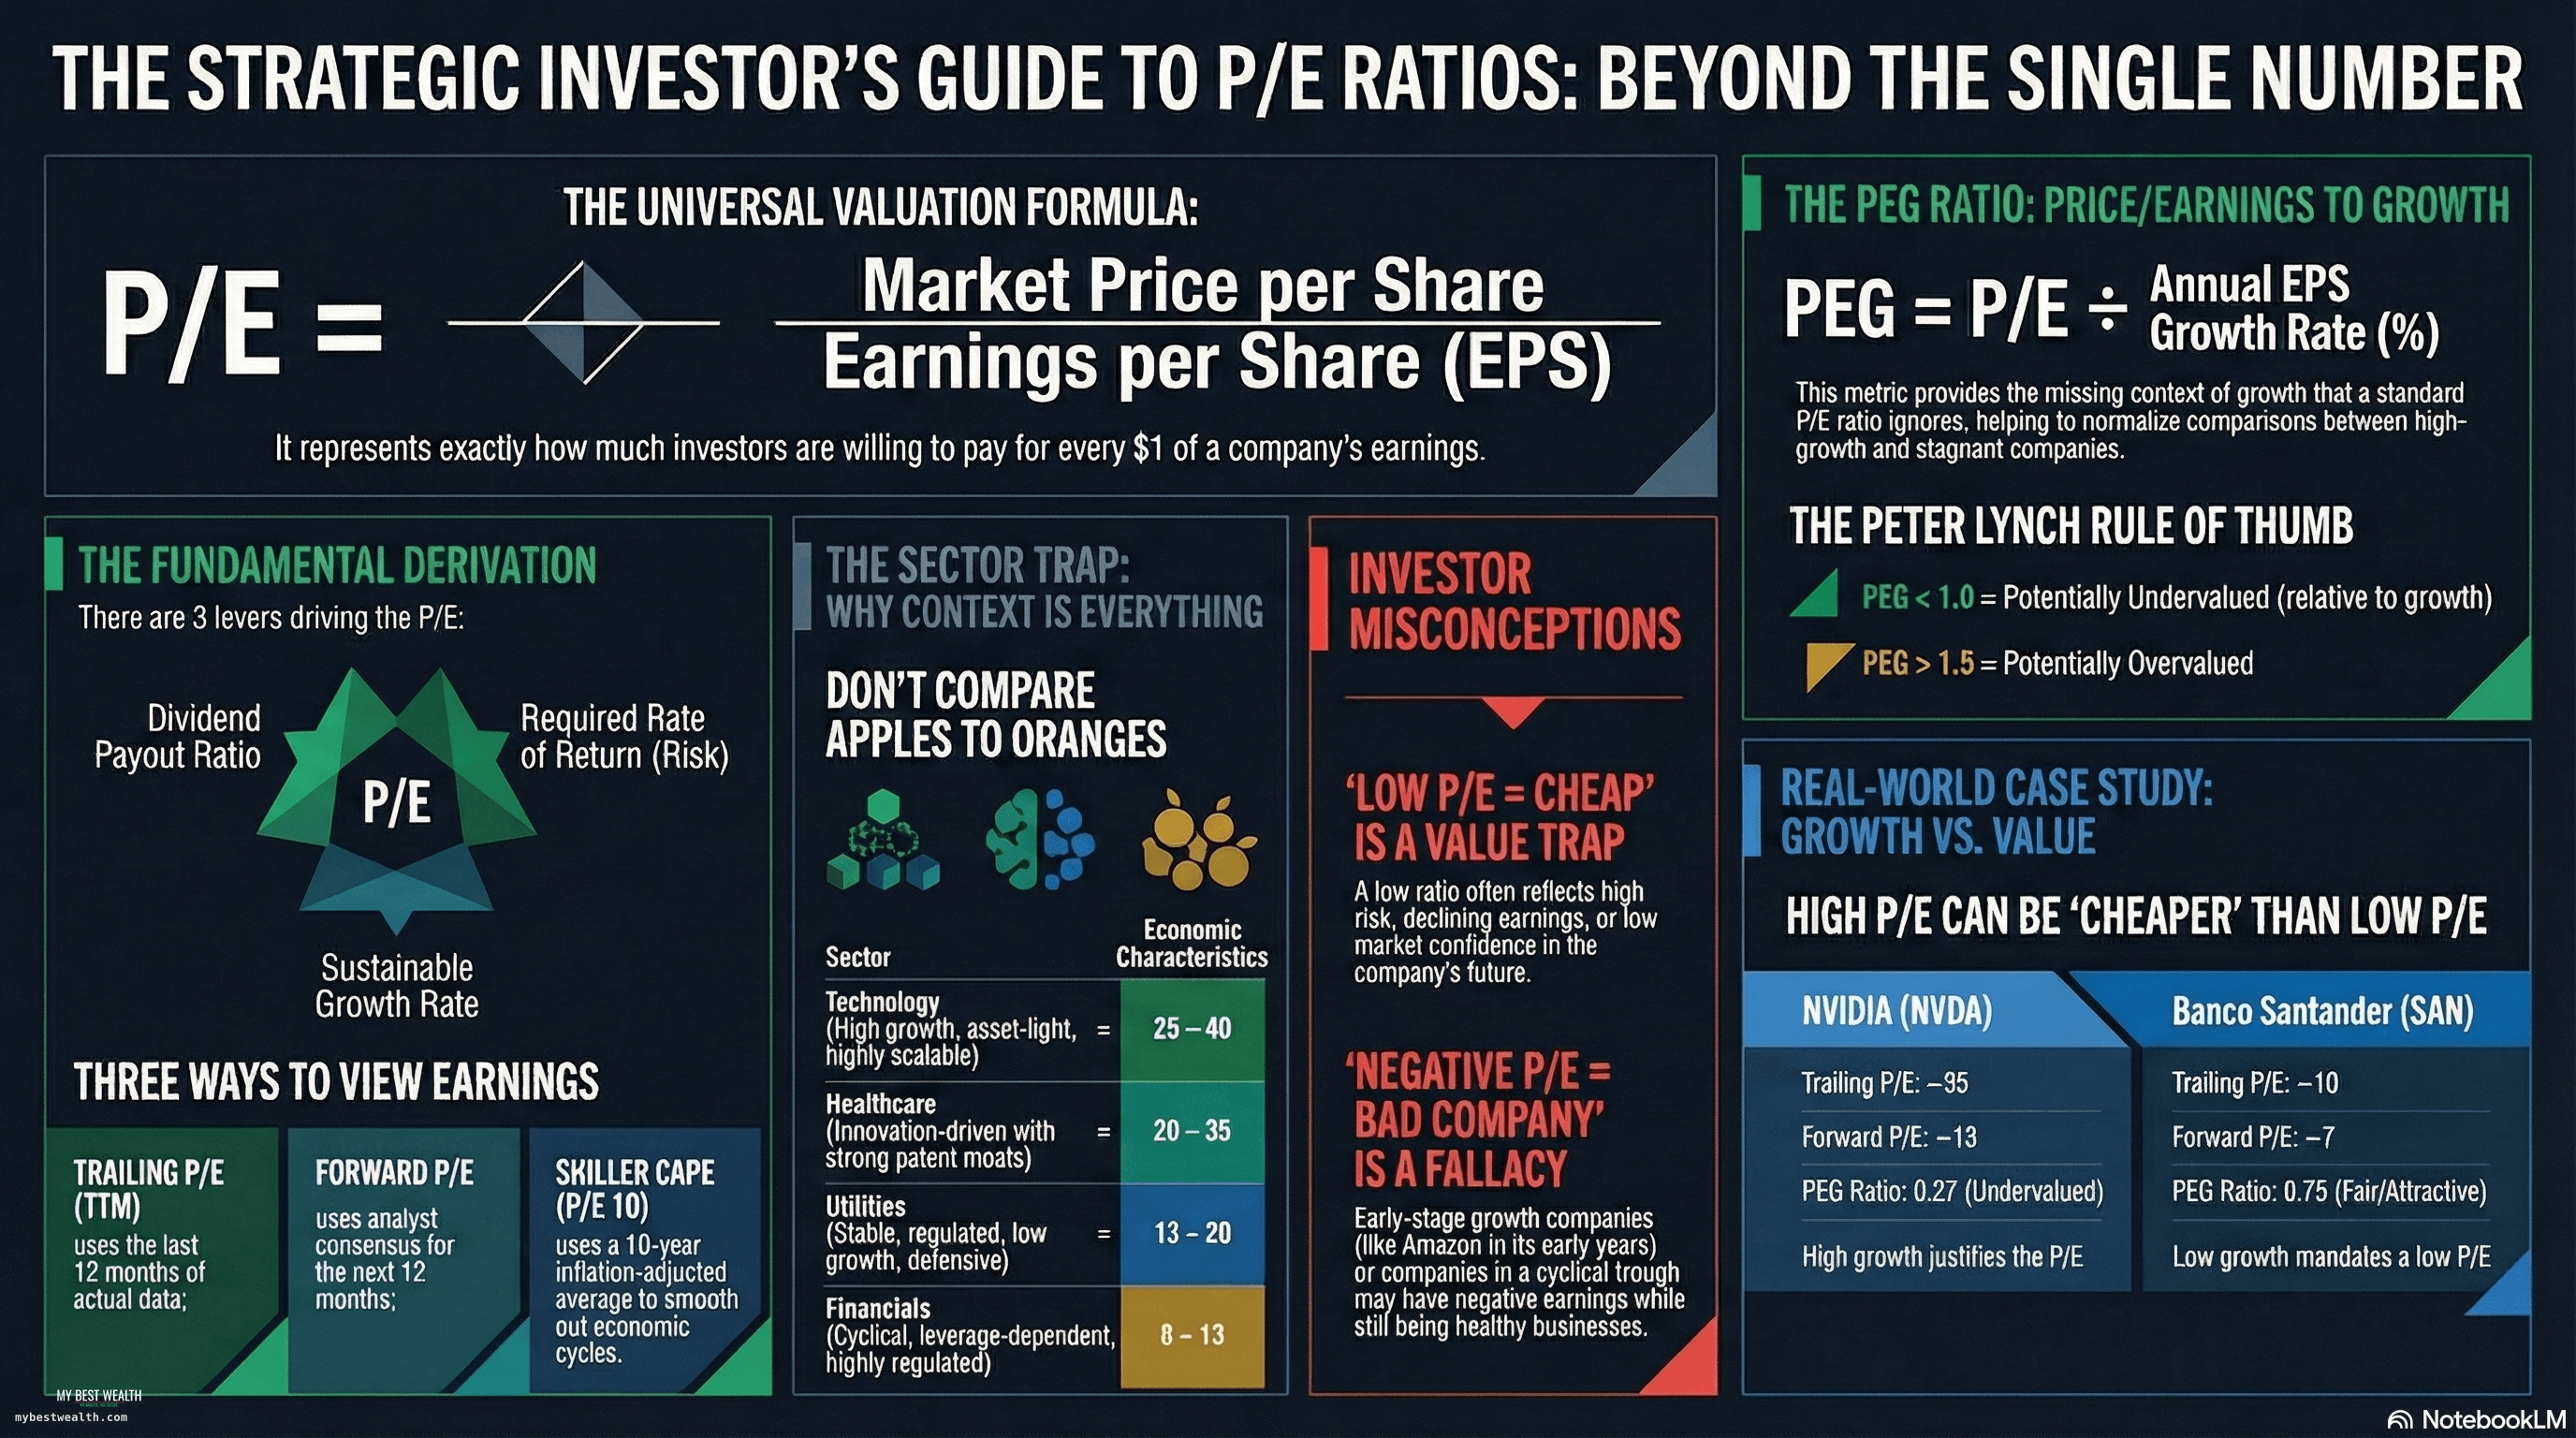
P/E Ratio Explained: What It Is, How to Use It & 3 Costly Myths
The P/E ratio is the most quoted — and most misunderstood — metric in finance. Learn why a 60x P/E can be cheaper than 8x, with real data and an interactive calculator.
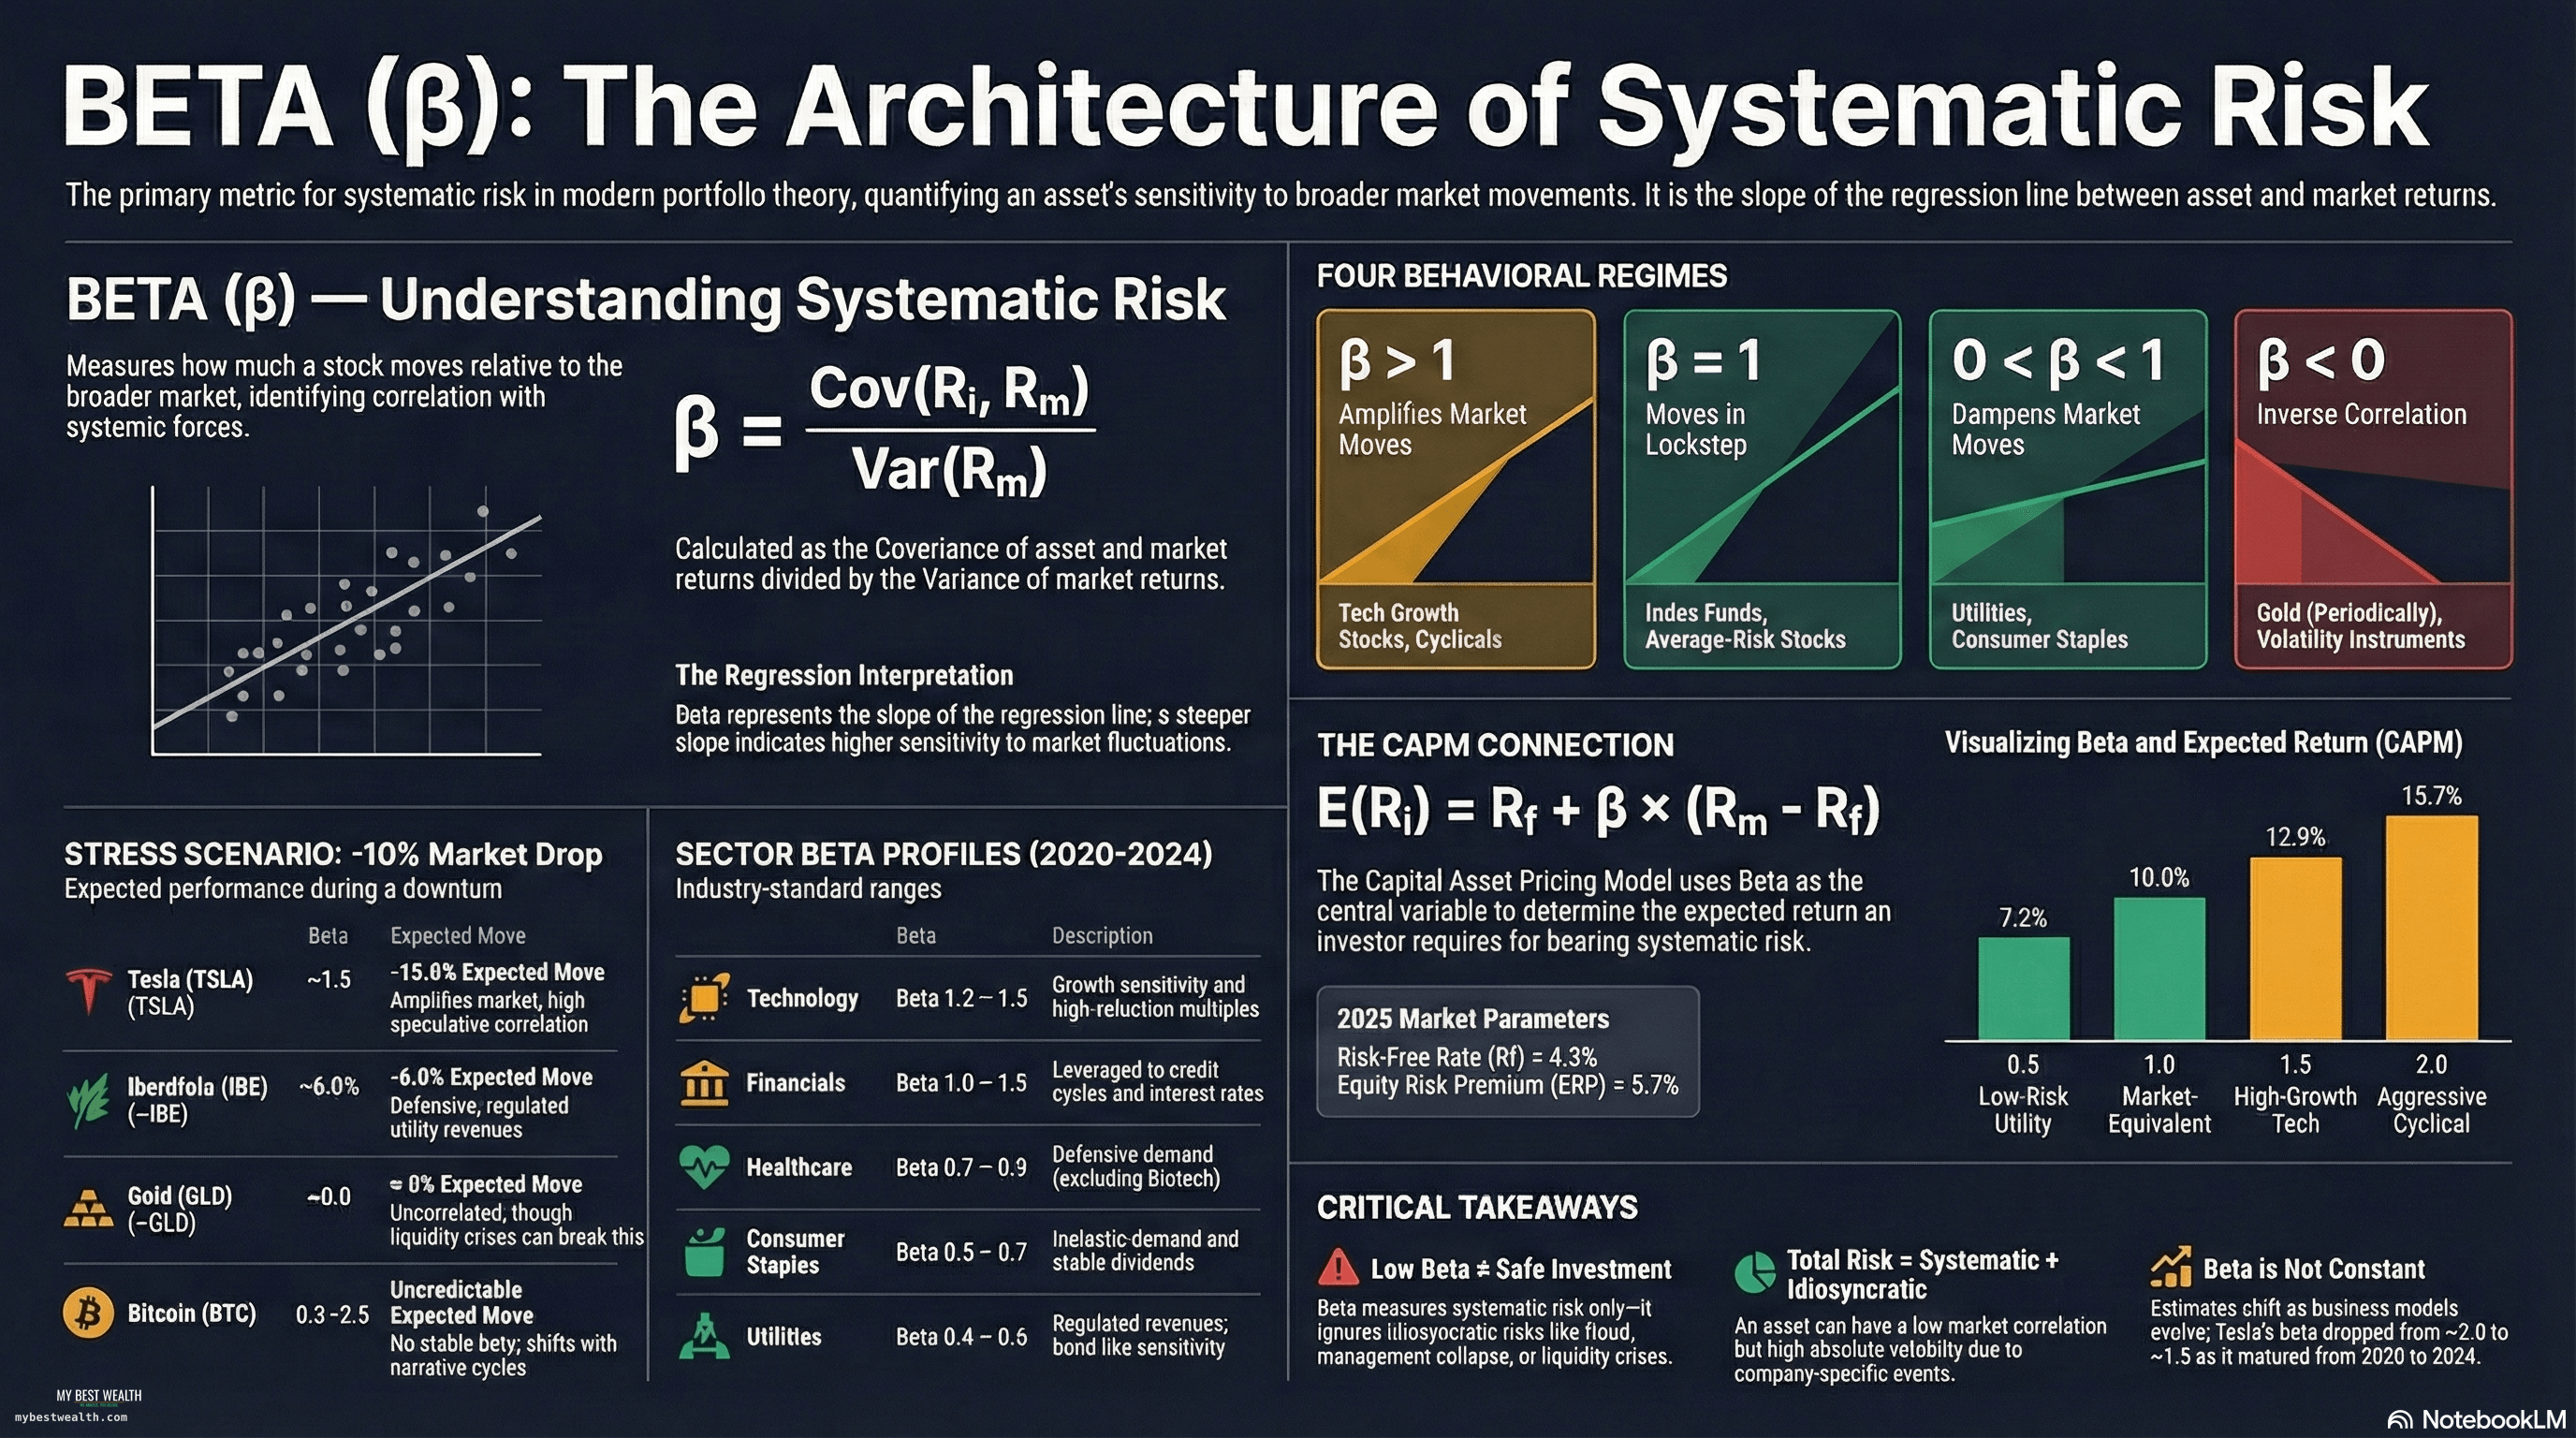
Stock Beta Explained: CAPM Formula & Why Low Beta Doesn't Mean Safe
Beta measures how much your stock moves with the market. Learn why low beta doesn't mean safe, with Tesla, Iberdrola, and Bitcoin as real-world cases.
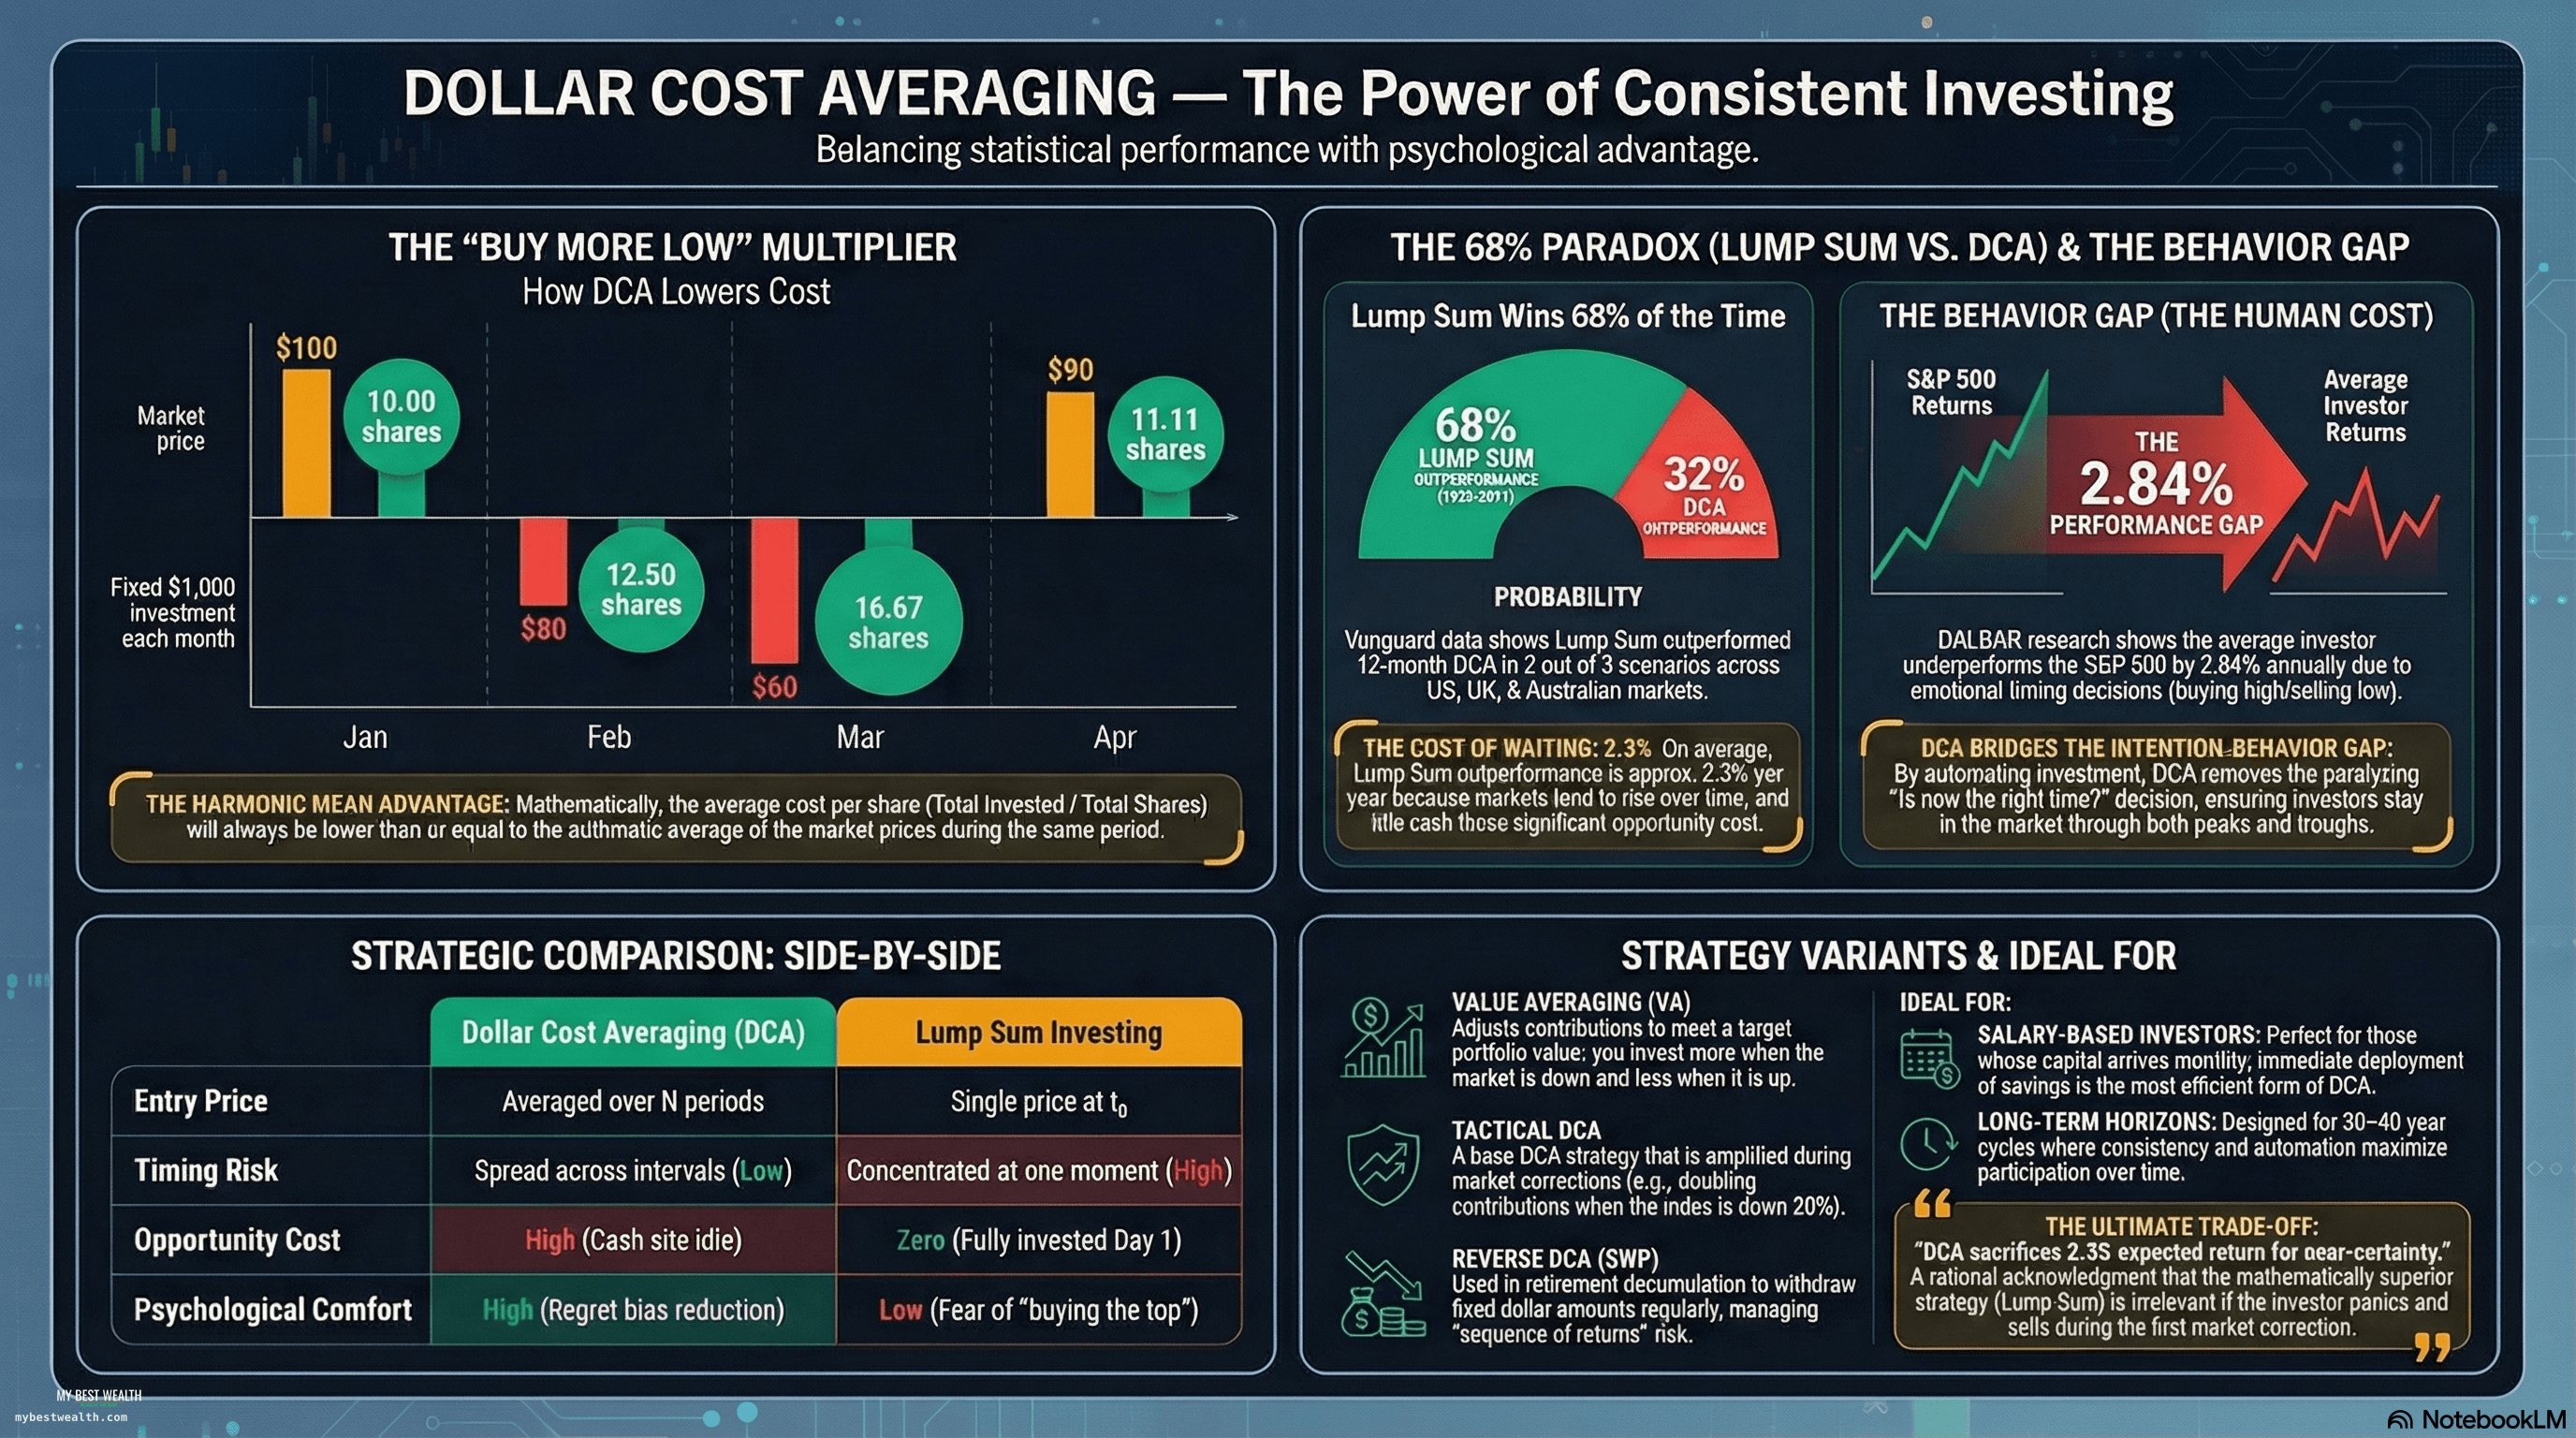
DCA Explained: What Dollar Cost Averaging Is, When It Works & When It Doesn't
DCA works — but lump sum beats it 68% of the time. Discover the paradox with Vanguard data, S&P 500 case study, and an interactive calculator.

Sharpe Ratio: Why Higher is NOT Always Better
The Sharpe ratio measures risk-adjusted returns. But many investors misuse it. We explain when it fails, why Madoff had a 'perfect' Sharpe, and how to interpret it correctly.
This article is for educational and informational purposes only. It does not constitute financial advice or personalized investment recommendations. Investing involves risks.
