Beta de una Acción: Qué Es, Fórmula CAPM y Por Qué Beta Baja No Significa Seguro
Artículos relacionados
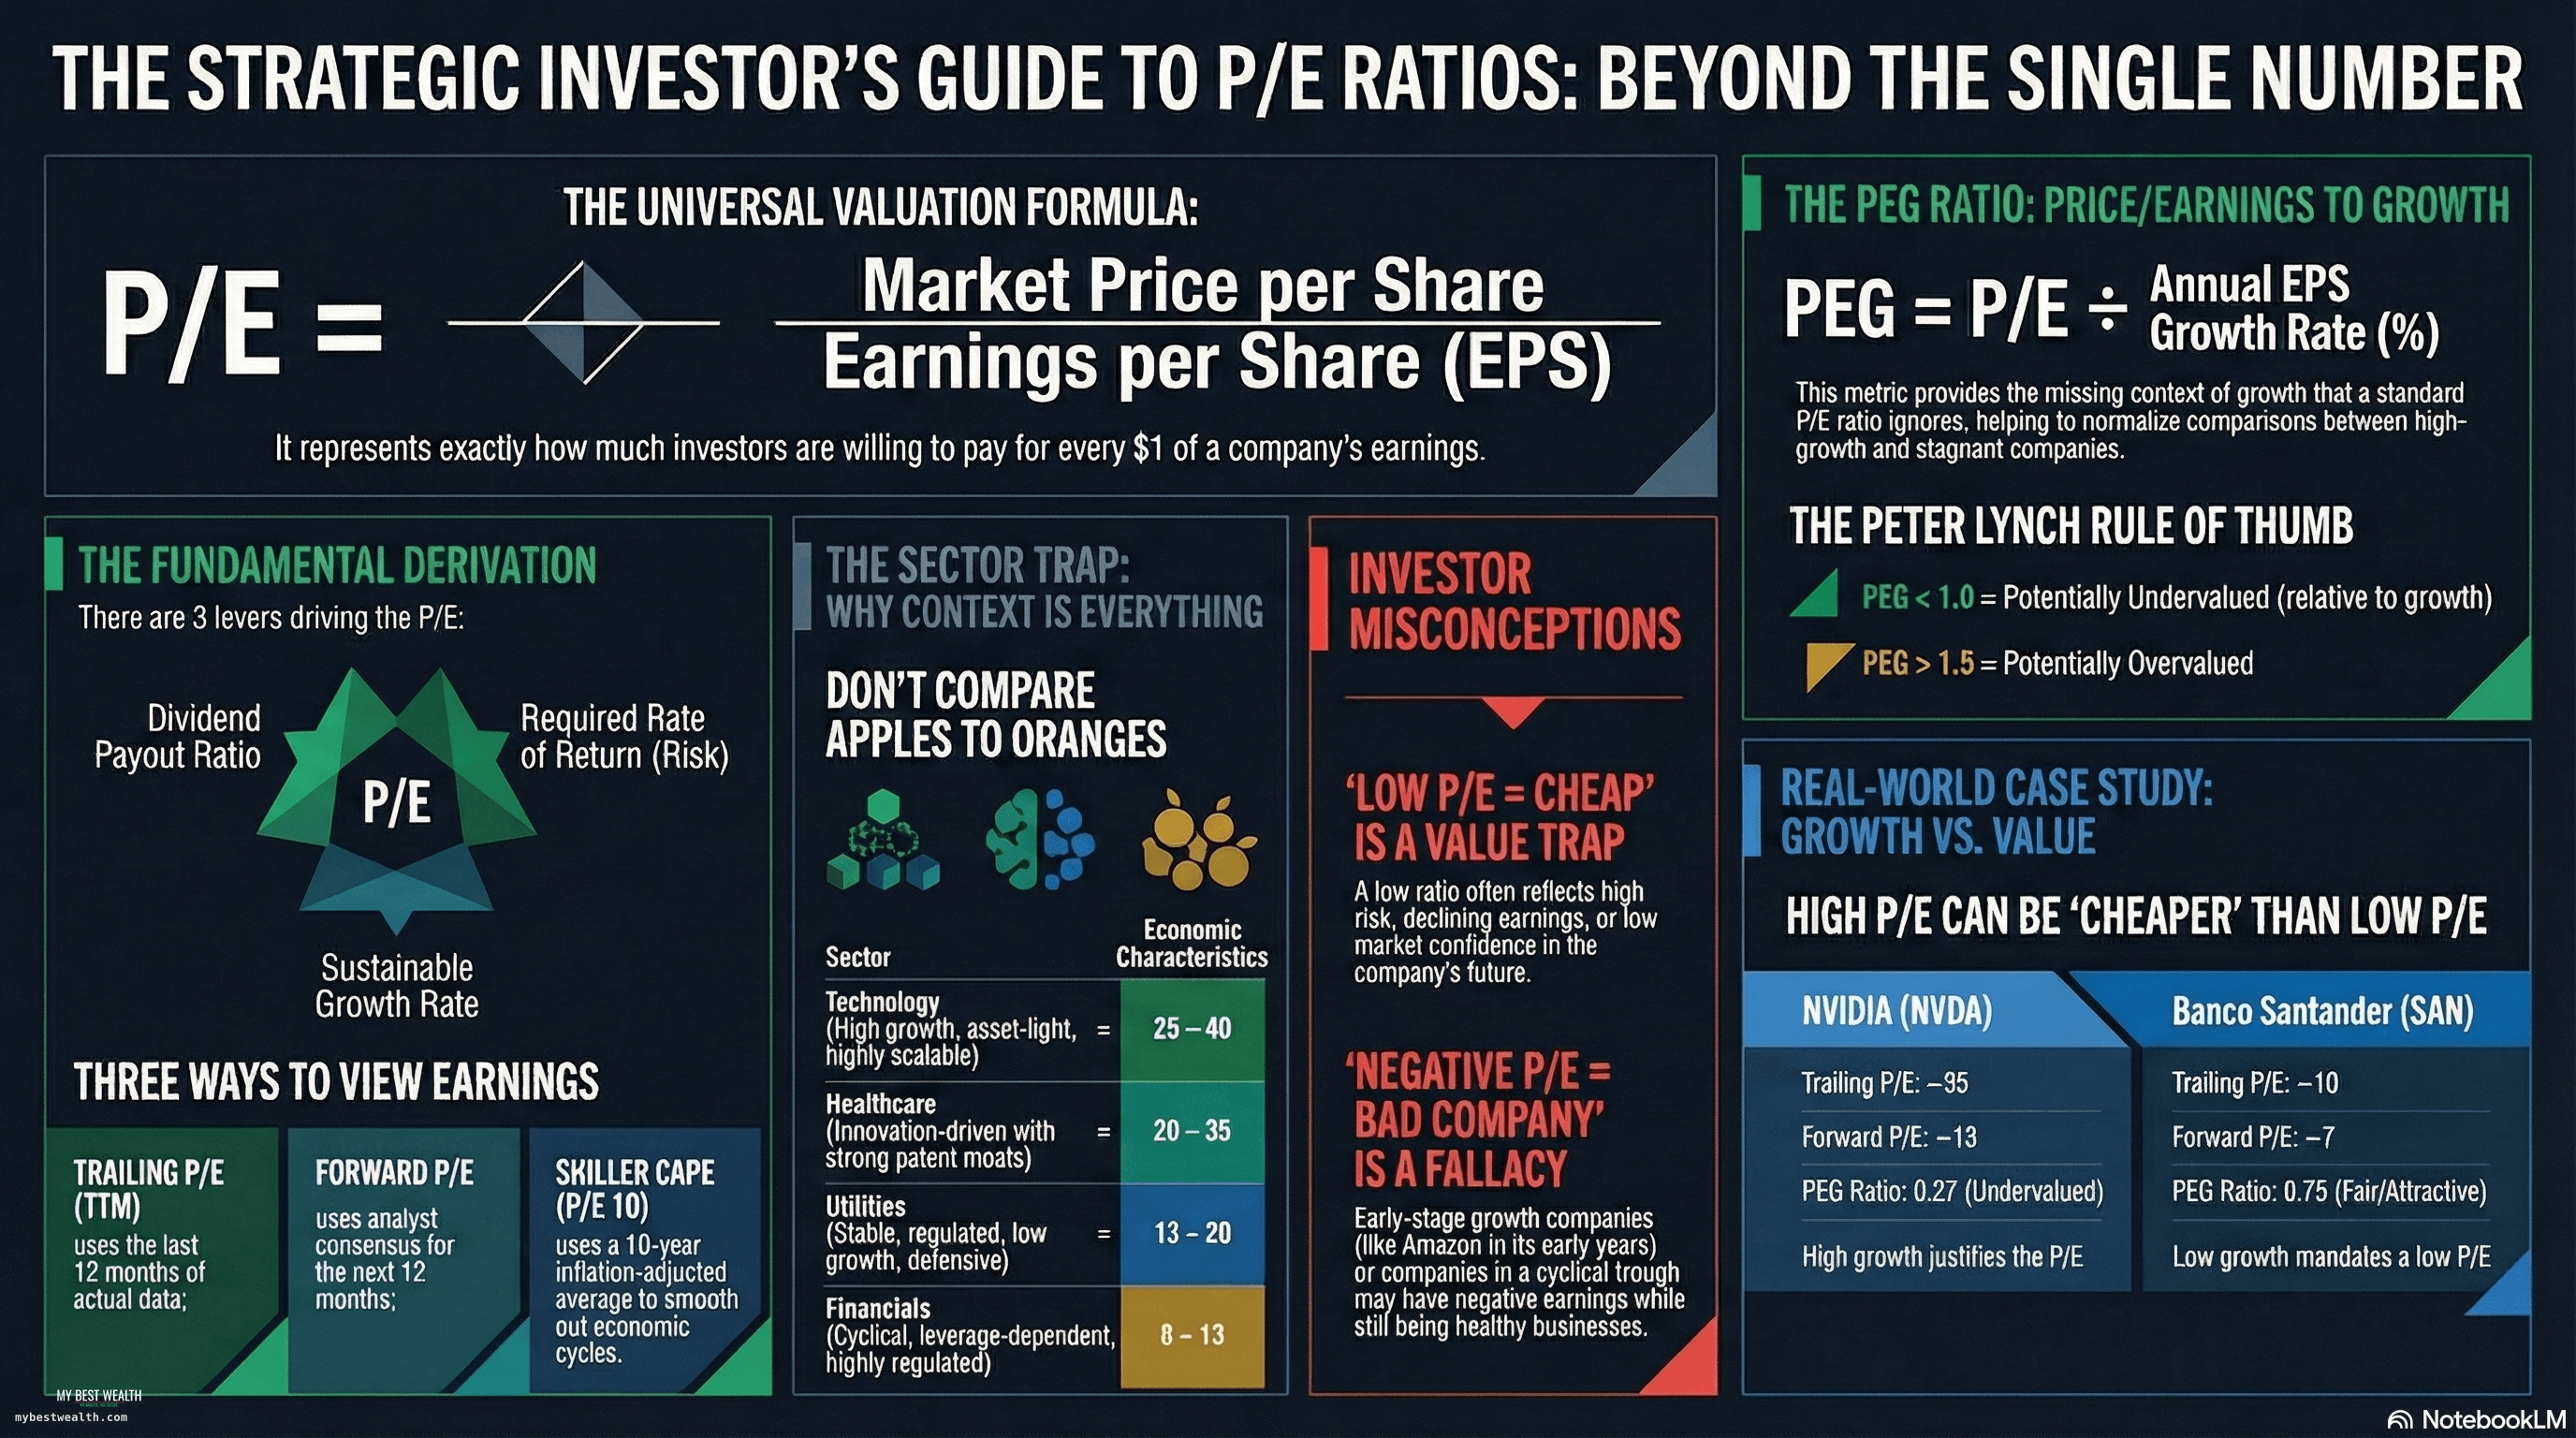
PER Explicado: Qué Es, Cómo Se Usa y Los 3 Mitos Que Cuestan Dinero
El PER es el ratio más citado — y más malinterpretado — del mundo financiero. Descubre por qué un PER de 60 puede ser más barato que uno de 8, con datos reales y calculadora interactiva.
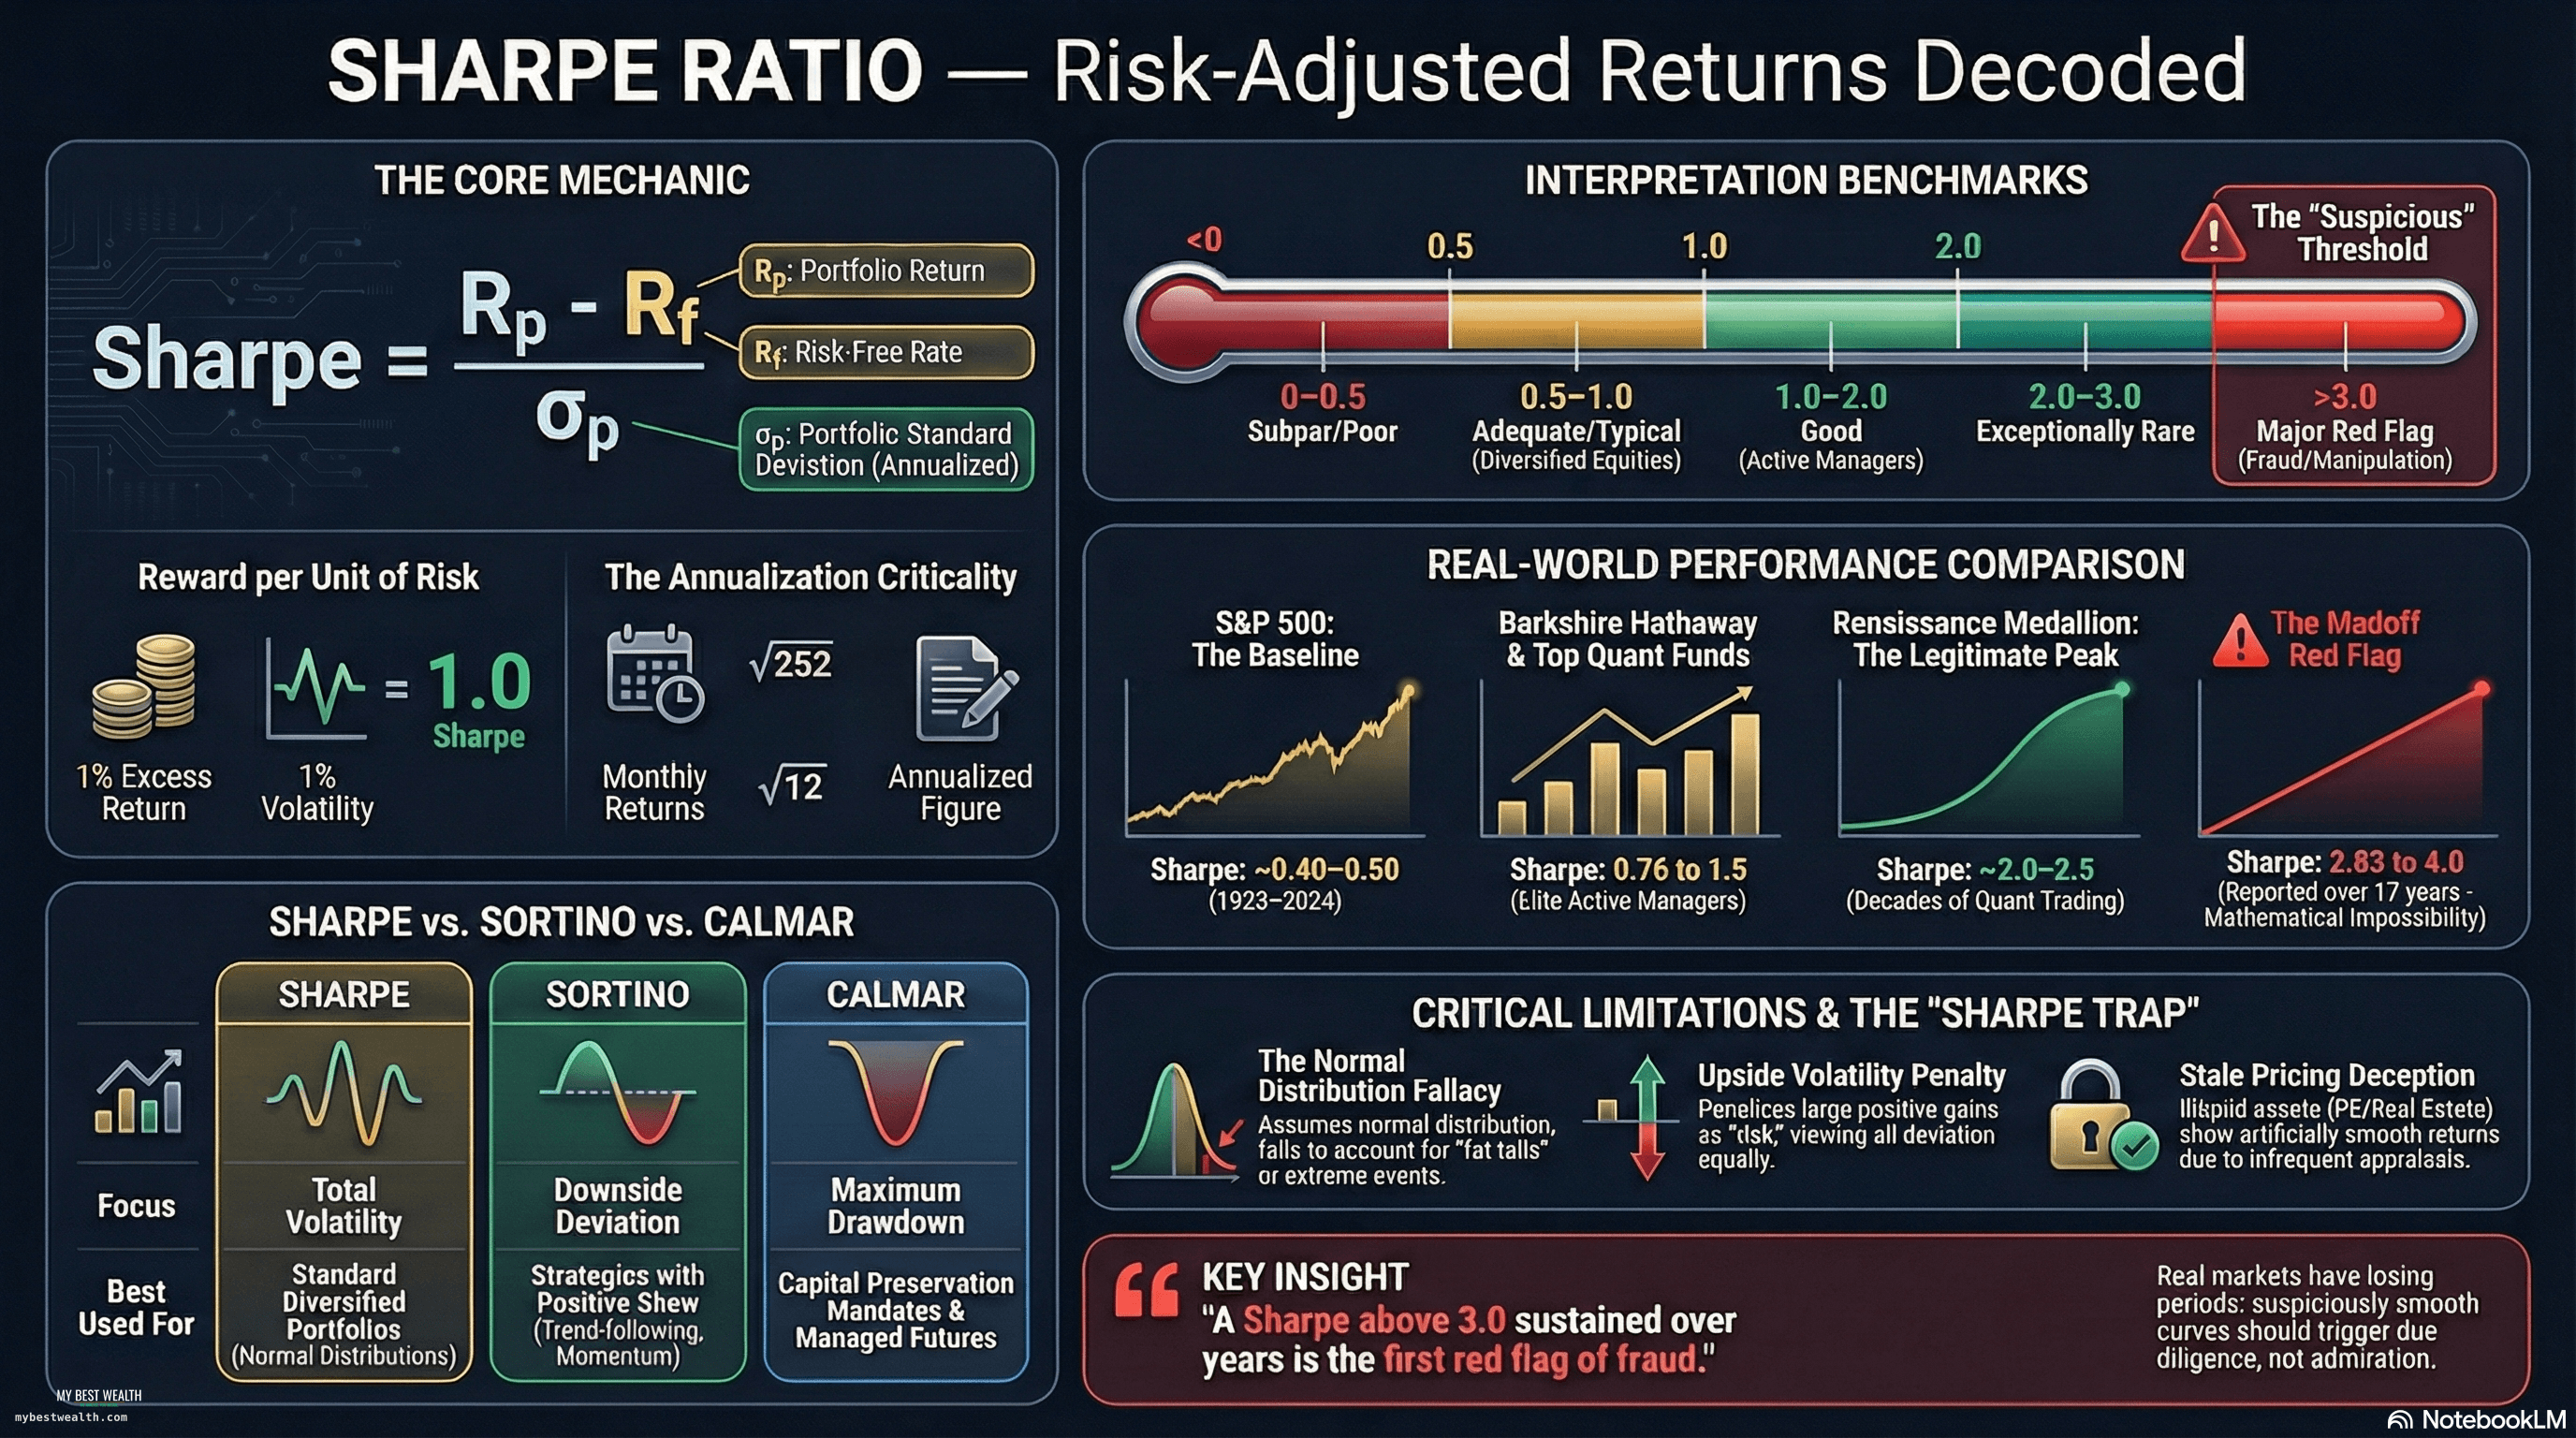
Ratio de Sharpe: Qué Es, Fórmula y Por Qué Un Sharpe > 3 Es Señal de Fraude
El ratio de Sharpe mide la rentabilidad ajustada por riesgo. Descubre cómo Madoff lo usó para engañar, por qué el S&P 500 rara vez supera 0.5, y calcula el tuyo con nuestra herramienta.
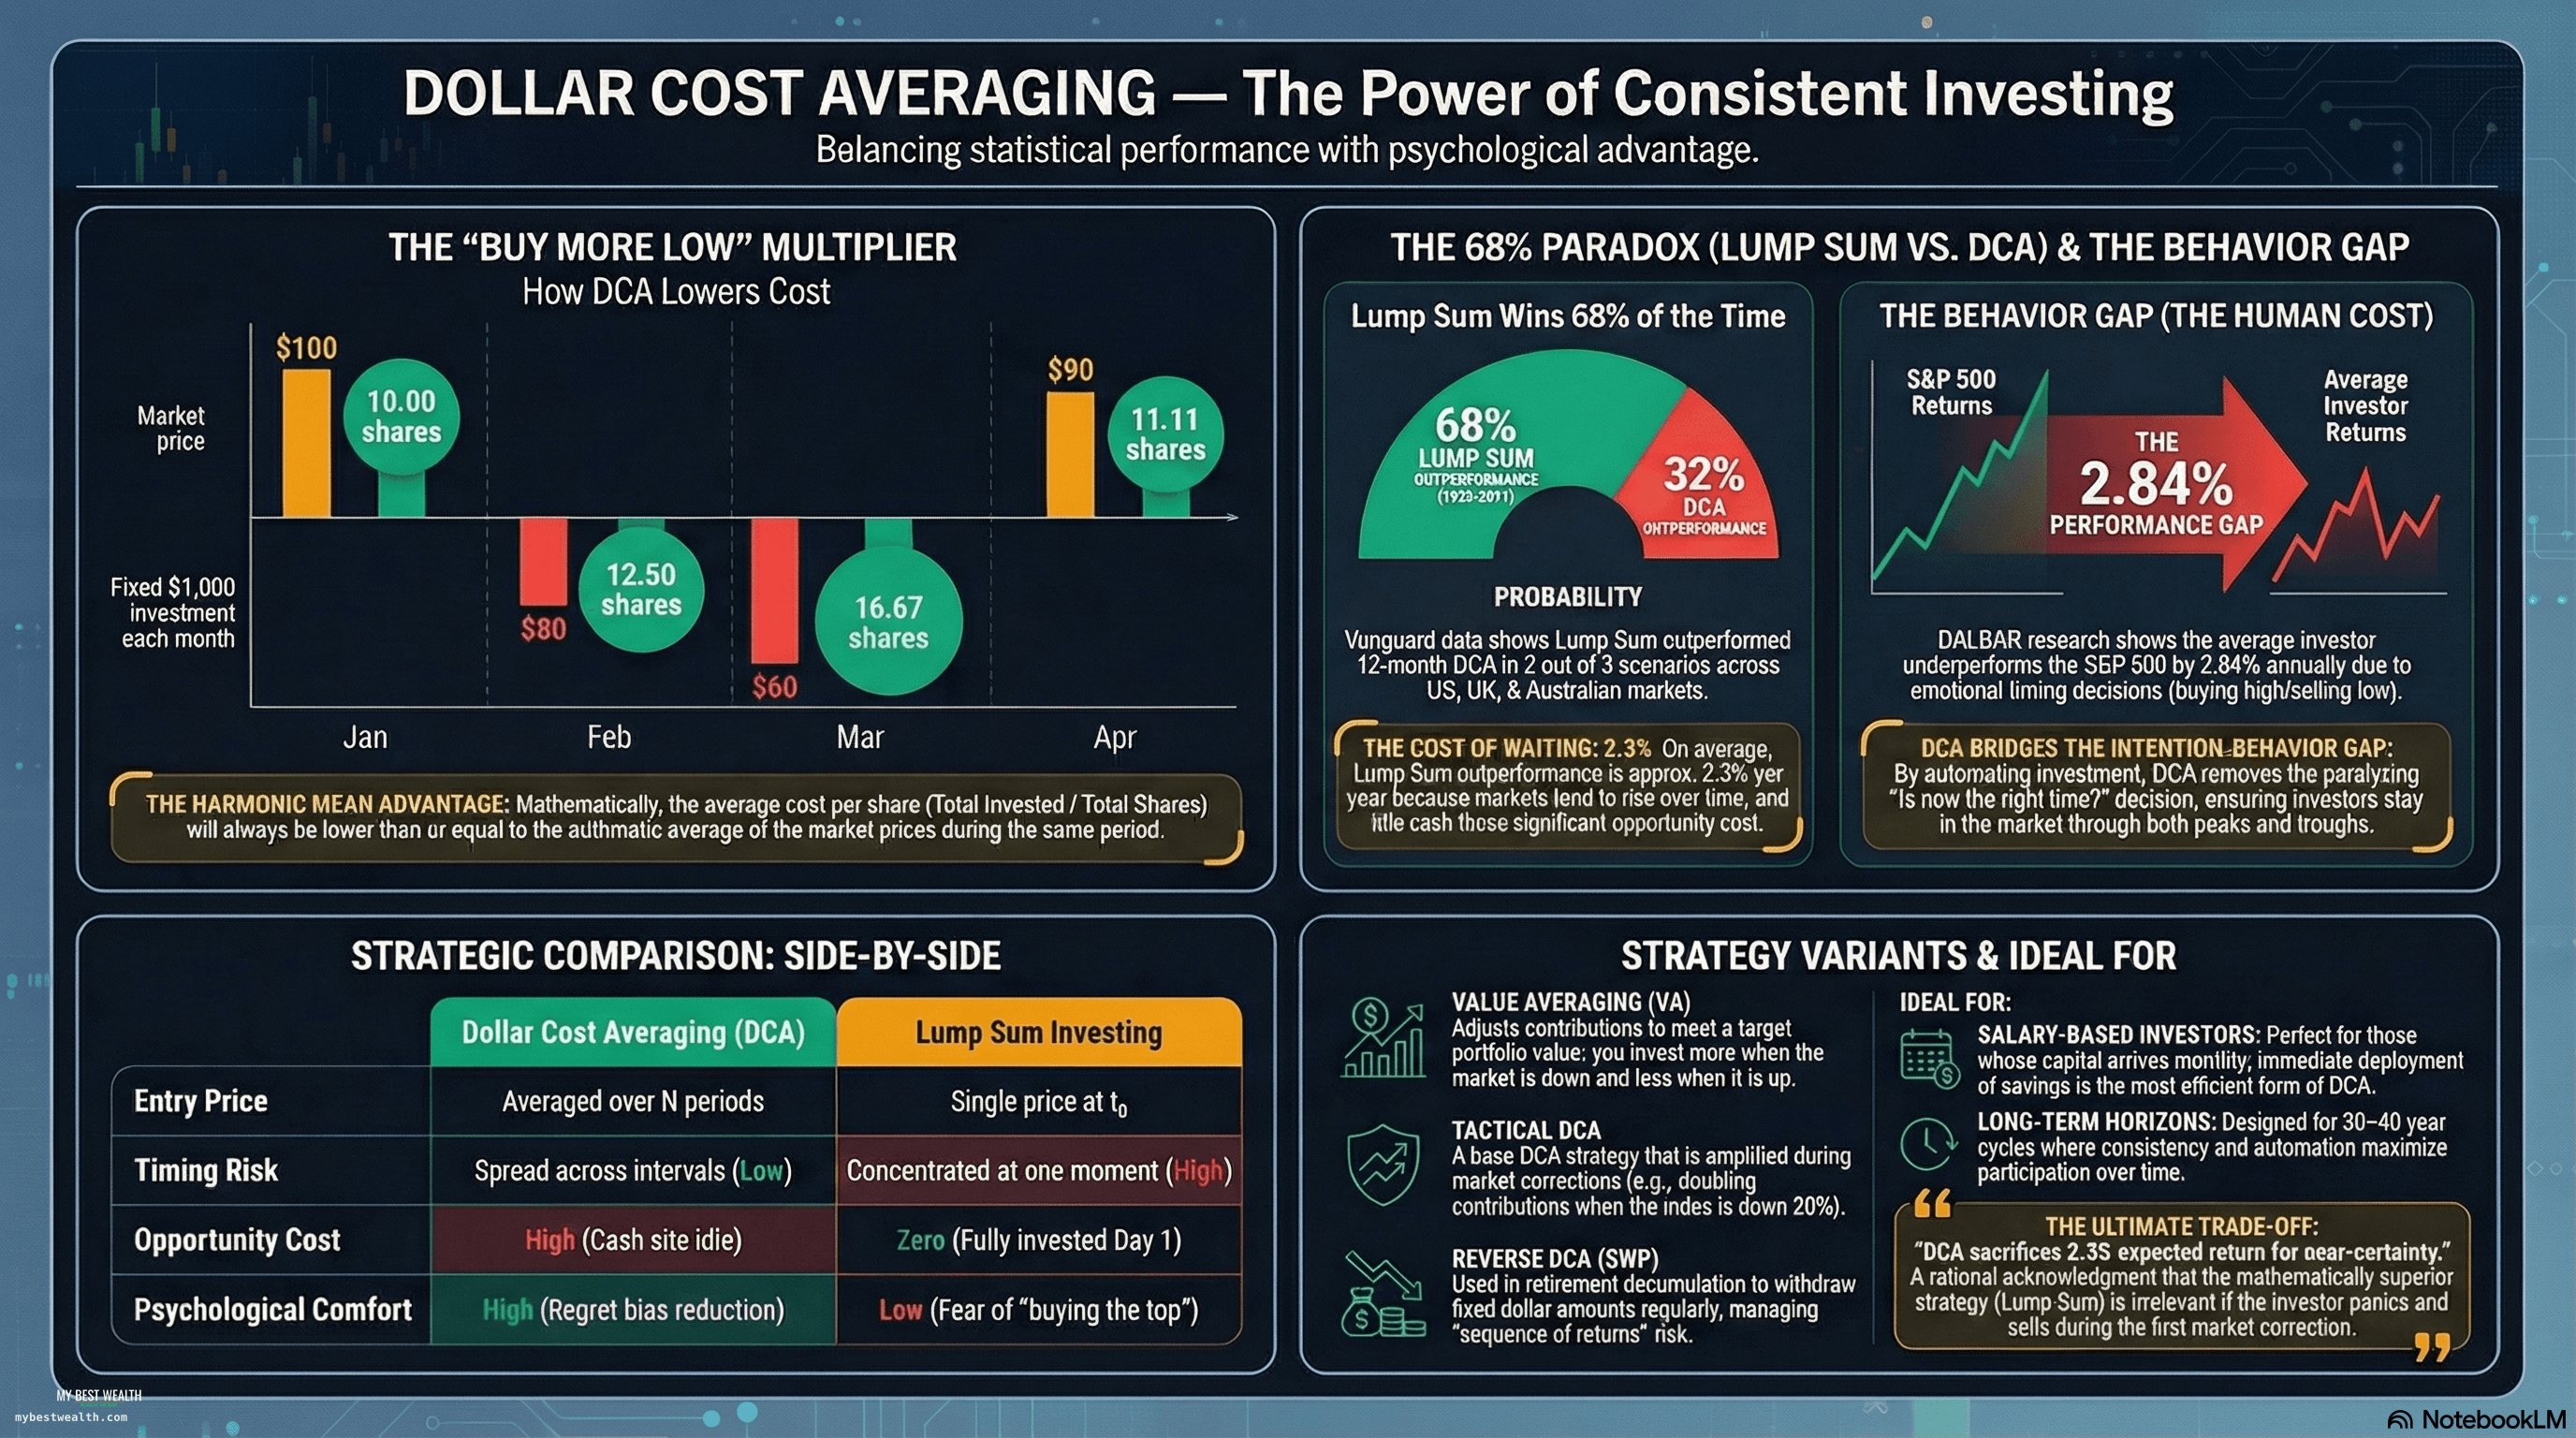
DCA Explicado: Qué Es Dollar Cost Averaging, Cuándo Funciona y Cuándo No
El DCA funciona — pero lump sum lo supera el 68% de las veces. Descubre la paradoja, con datos de Vanguard, caso real del S&P 500 y calculadora interactiva.

Beta: El número que te dice cuánto riesgo de mercado asumes
Beta mide la sensibilidad de una acción al mercado. Pero no mide TODO el riesgo. Aprende qué significa beta 0.5 vs 1.5, por qué Tesla tiene beta alta y los utilities baja, y sus limitaciones.
Este artículo tiene finalidad educativa e informativa. No constituye asesoramiento financiero ni recomendación de inversión personalizada. Invertir implica riesgos.
